Are Shakespeare’s tragedies all structured in the same way? Are the characters rather isolated, grouped, all connected?
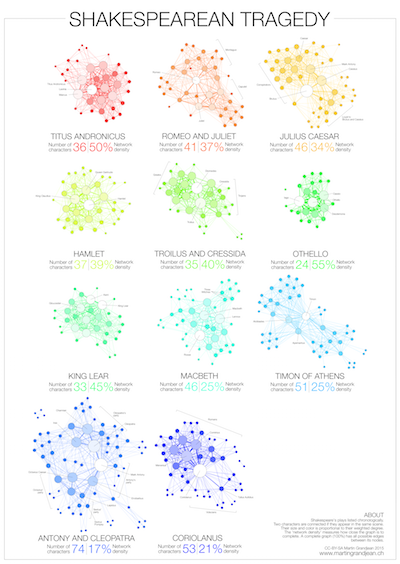
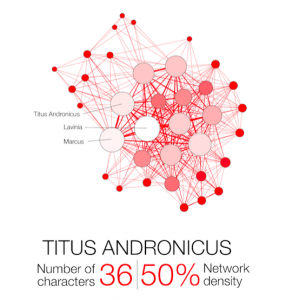
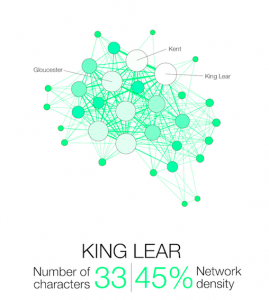
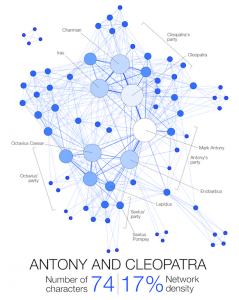
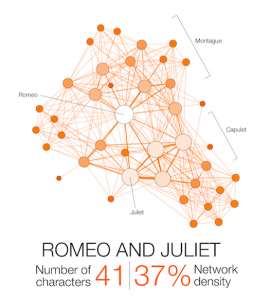
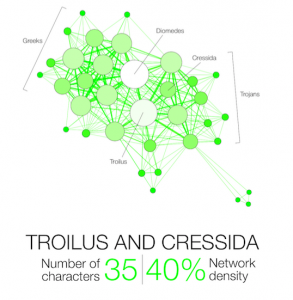
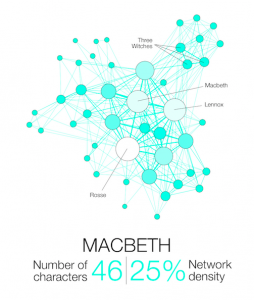
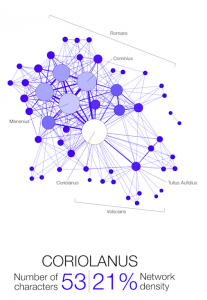
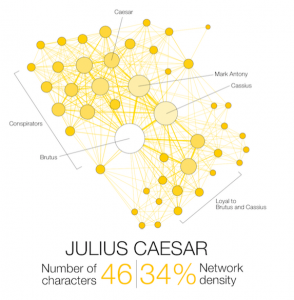
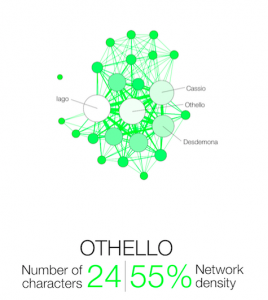
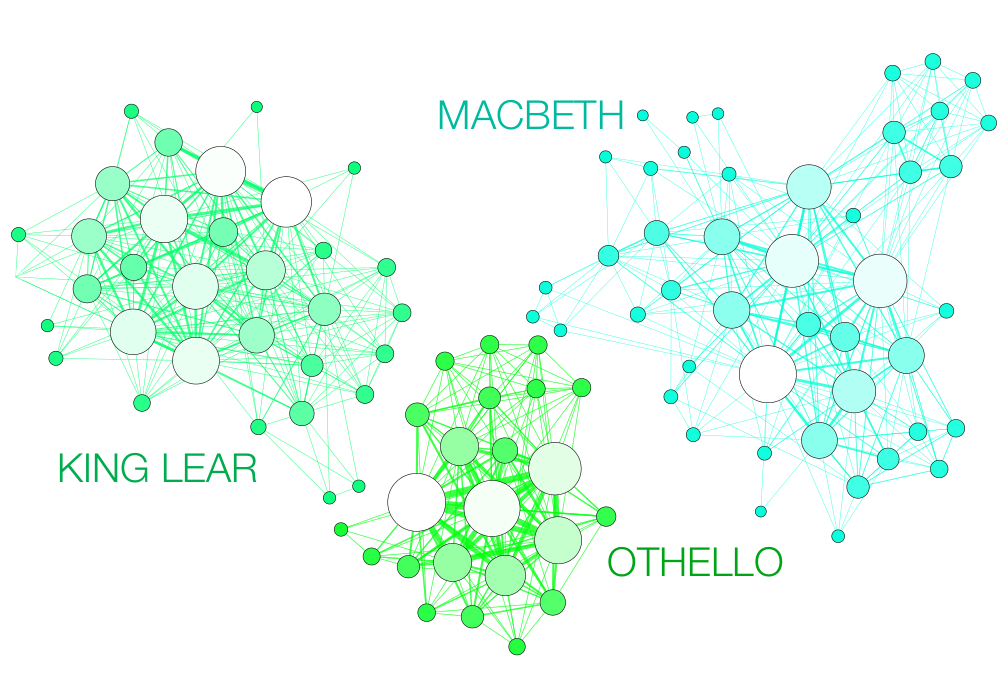 Narration, even fictional, contains a network of interacting characters. Constituting a well defined corpus, the eleven Shakespearean tragedies can easily be compared: We propose here a network visualization in which each character is represented by a node connected with the characters that appear in the same scenes. The result speaks for itself: the longest tragedy (Hamlet) is not the most structurally complex and is less dense than King Lear, Titus Andronicus or Othello. Some plays reveal clearly the groups that shape the drama: Montague and Capulets in Romeo and Juliet, Trojans and Greeks in Troilus and Cressida, the triumvirs parties and Egyptians in Antony and Cleopatra, the Volscians and the Romans in Coriolanus or the conspirators in Julius Caesar.
FULL-SIZE POSTER |
 |
|
Get the full size poster here: ➔ Full-size poster (5460×4000) |
SHAKESPEAREAN TRAGEDY
ABOUT
Two characters are connected if they appear in the same scene.
Their size and color intensity are proportional to their weighted degree.
The ‘network density’ measures how close the graph is to complete. A complete graph (100%) has all possible edges between its nodes.


Hi Martin,
Really impressive visualization and comparison.
would it be possible to get your raw network data. This would make an awesome Neo4j GraphGist.
(You could also decide to participate in our winter challenge yourself 🙂
http://neo4j.com/blog/neo4j-graphgist-challenge-may-the-graph-be-with-you/
This is awesome — thanks for all the work you did putting it together!
Do you have any versions where the names of some of the more minor characters are displayed?
Something like that :
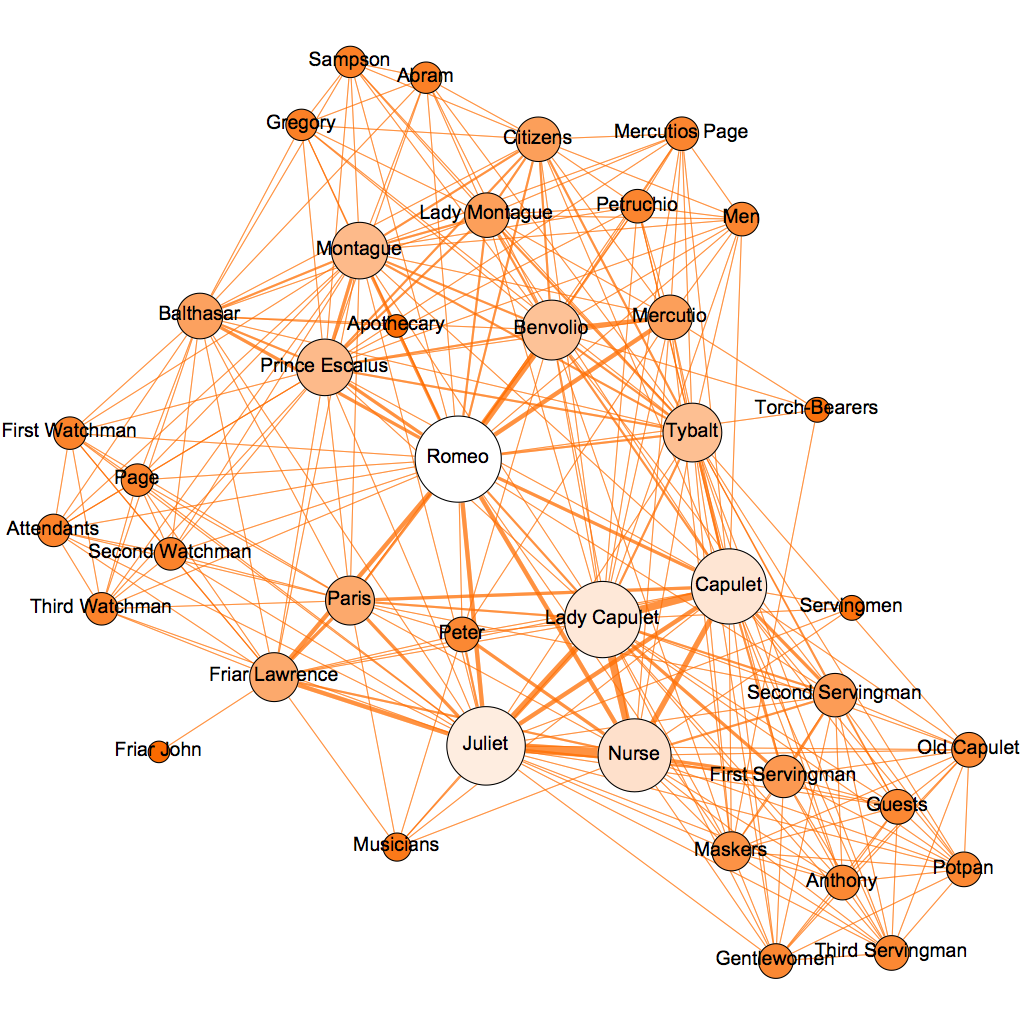
For graphical reasons, I choose not to display the names on the published version, but I of course have the data behind. For what purpose do you need this? It obviously requires me some time to produce.
thanks, that’s exactly what I was looking for. I don’t need it for a particular purpose, I just think it adds a lot of depth to see how the more minor characters come into play.
Thanks for the effort it takes to create this amazing graphs. I would like to write an article in Spanish using them and publish it next month for the Bard’s death anniversary, the version with all characters names would be required and, of course, you would be mentioned on the credits. Please contact me.
Without names these graphs are just circles connected with lines. Even if the graphics are at stake, it would be great to see the names in the circles.
You’re right. In fact, this visualization was just an experimental project, to show the interest of comparing many very similar networks, at a “global” level. Adding all the names would have been visually very heavy/unreadable for this purpose.
Hovering a mouse to reveal names one at a time would solve the readability issue, though I do agree it would take time to set up. May be worth it, however, since the visualizations as they are now are of rather limited use to users.
Amazing work! Thanks for sharing. Have you tired to map his comedies? Is their network density different from the tragedies?
No comedies yet (as I wrote, this was just a quick experiment), but as this post drove lots of interest, I may produce other Shakespeare graphs soon.
Hi, just wondering how you chose the degree weight?
I’m not sure to understand your question. The “weighted degree” measures the number of (weighted) connexions a node has. If character A appear with character B 3x, with character C 1x and with character D 5x, he will have a degree of 3 and a weighted degree of 9.
Thank you, that was the exact answer I was looking for. I wasn’t sure if it was for total number of times the character shared a scene (which it is) or it was per scene shared by each pair of characters.
Beautiful, indeed! What data did you use for it? is it connected to http://shakespeare.acropolis.org.uk/ projects ?
Thanks! No, this small project is not connected to any other major research. Data was manually coded from Shakespeare plays.
which platform/Software you use to make this?
Hi, the tool I use is Gephi (gephi.org)
I am studying Othello at school… Can you let me know who the character is on their own in the graph for Othello?
Sure!

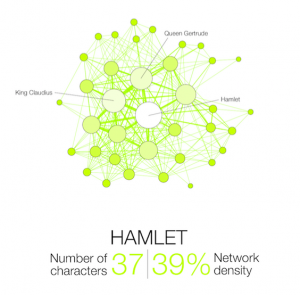
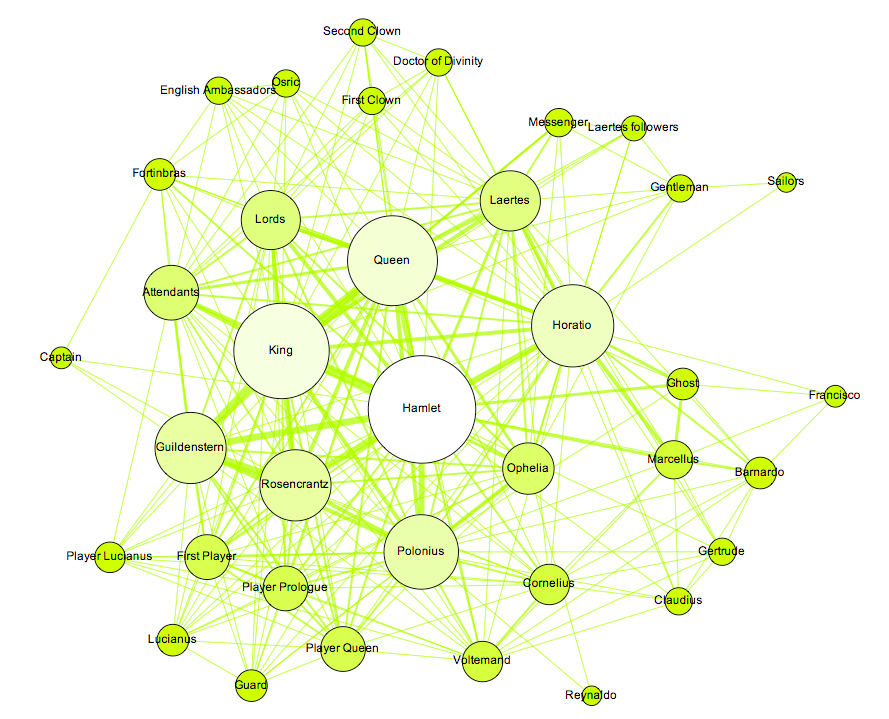
Oh my goodness, this is amazing! If you happen have the spare time and don’t mind another request, I would love to see a complete version of the Hamlet chart, if only because I’m slightly obsessed with that play. Regardless, thanks for sharing! It’s really fascinating.
Hamlet is a very dense network:
Thanks so much! 🙂
Are you planning to do that to the comedies as well?
No, as it is a side project I chose a restricted dataset.
Very nice – I applied a similar technique for that other great work of literature: The Simpsons!
http://www.vislives.com/2014/09/the-simpons-social-netwok-season-1.html
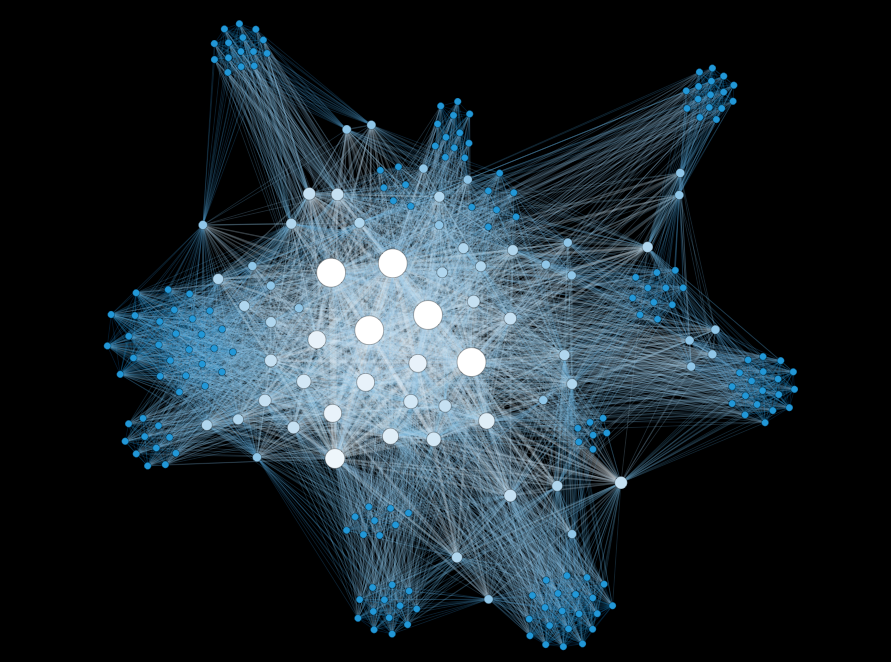
Great work! the “single episode” clusters are indeed very clear.
muy buen trabajo, pero seria bueno que publiques el dataset para poder profundizar el estudio, saludos!
Dear Mr. Grandjean,
Could you tell me what kind of software u used in order to make these graphs? I find them very interesting and would like to do something similar for my Master’s thesis in Dutch literature.
Best wishes,
Tessa
Hi, I’m using Gephi (tutorial here)
This is so cool! I was recently an Angus in a production of Macbeth where, just for fun, we hand-drew our own network diagrams of the characters.
I love how high Ross’s weighted degree is to the network: makes sense, as he is the king of information transmission.
If you again happen to have the time and don’t mind another request, I’d really love to see the version of Macbeth with all the nodes labeled.
Hello
The graph you display are computed from the text. But you can apply some algorithms to “extract” information, for example;
– Have you tried to apply some “communities computatin algorithms” in these graphs?
– Or to apply the Pagerank algorothm (or any similar algorithms)
Thanks.
Robert.
Right, the purpose here was more to provide a graphical overview than quantitative insights. In terms of communities, I fear that on such simple graphs, the result wouldn’t be a revolution for literary scholars 😉 The small size of the graphs would also produce very predictable Pagerank results, but it’s clear that I’m applying these methods to much bigger datasets, or in cases where precise hypothesis are formulated.
what is the point without the actual data?
Cool! 🙂
Can you share the data? Do you think it would be more precise to do it based on average proximity instead of count of appearances in scene?
Did you find any interesting on top of density?
Do you run a script for network generation?
What did you use to map these beautiful graphs?
I used Gephi.
Hi, I love your compilation of networks, and was thinking of analysing the network of Romeo and Juliet in depth –would it be possible for you to share your data on that particular network? (e.g. labels of nodes/individual edges/individual weightedness/ how you chose to weight them)? Thank you!! 🙂
Hi, thank you for your message. Could you please write me an email (see the “contact” tab) so that we can discuss these questions further?
Hello, Do you have a more detailed network for Macbeth? One of my art history dissertation chapters deals with a sculpture of Lady Macbeth. She rose in popularity as a femme fatale figure in the 19th/20th century, and it would be interesting and insightful to know her ‘network’ presence. Thank you!