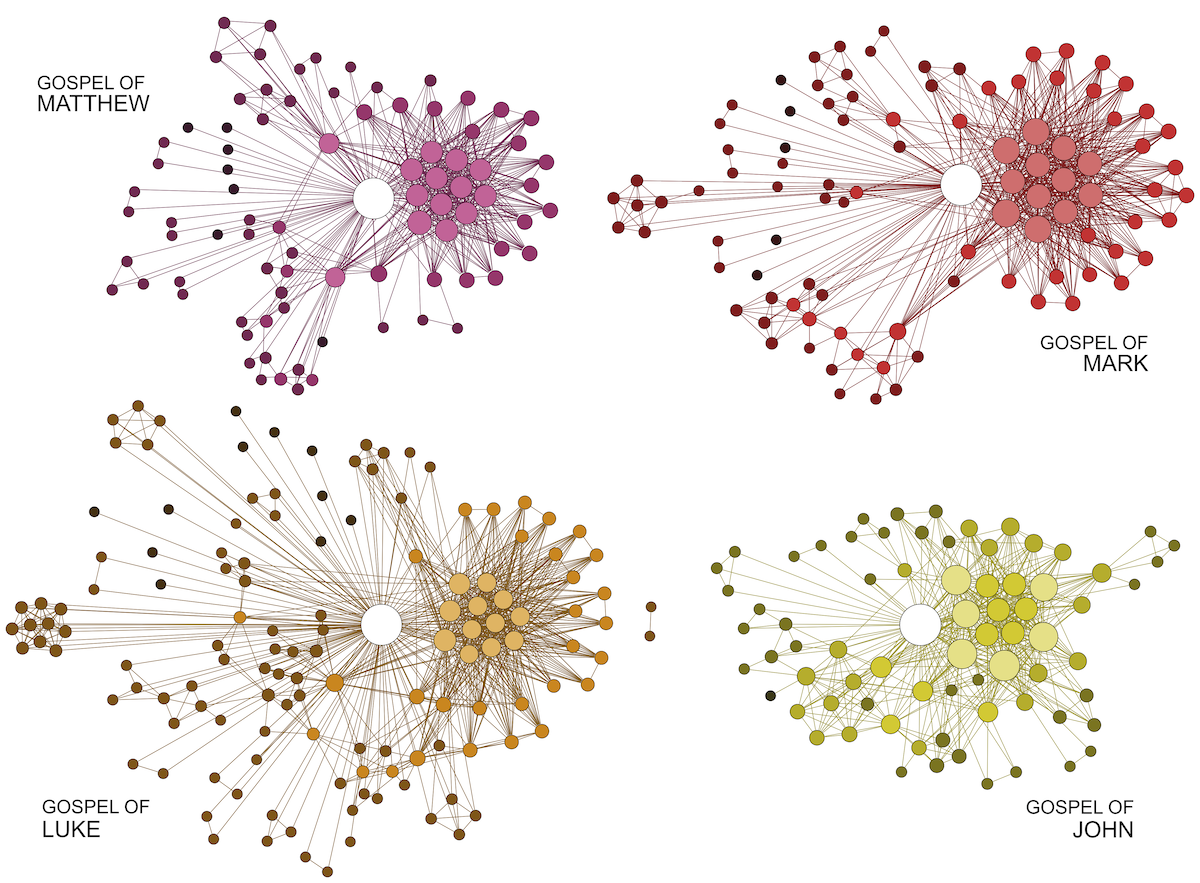
The four Gospels tell a broadly similar story but have slightly different structures: their constitution has been one of the most studied subjects for centuries. Without revolutionizing a field of research consisting in the careful study of these texts, network analysis allows a relatively simple visualization of the main structural characteristics of the character networks of the Gospels.
Back in 2013, a theologian colleague suggested that I use the tools of network analysis to visualize these texts. After having communicated them, I had not thought of putting these results online, because of their very unconventional nature for this rather traditional field of study. But since then, character network analysis has developed (Rochat works on Rousseau in 2014, my networks of Shakespeare’s tragedies in 2015, or this interface to visualize theatre plays as interactive networks with colleagues from UNIL in 2016, and an increasing number of publications in 2019 and 2020, see DraCor by Frank Fischer et al., or this survey by Labatut and Bost, for example), so it makes more sense to unearth that old stuff today.
PAPERGRANDJEAN Martin (2013). “Comparing the Relational Structure of the Gospels: Network Analysis as a Tool for Biblical Sciences“, Society of Biblical Literature (SBL), University of St. Andrews. Note that this conference paper tries a very experimental approach, in particular given the state of the field of character network analysis in 2013 and the rarity of the use of these methods in biblical sciences. |
How to read these graphs
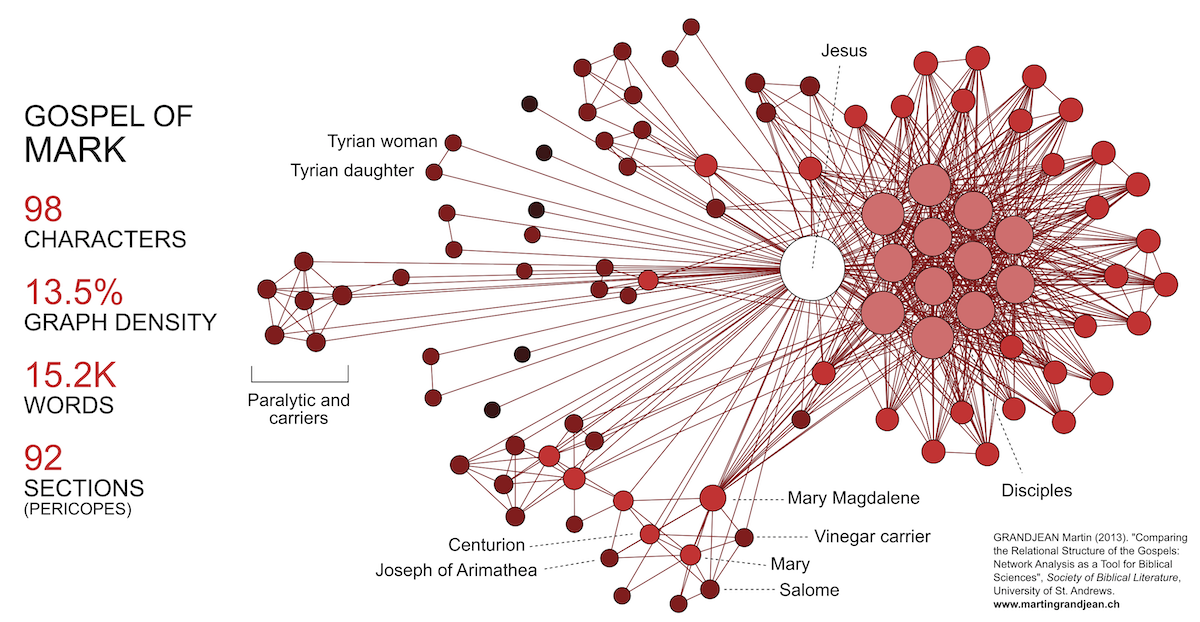
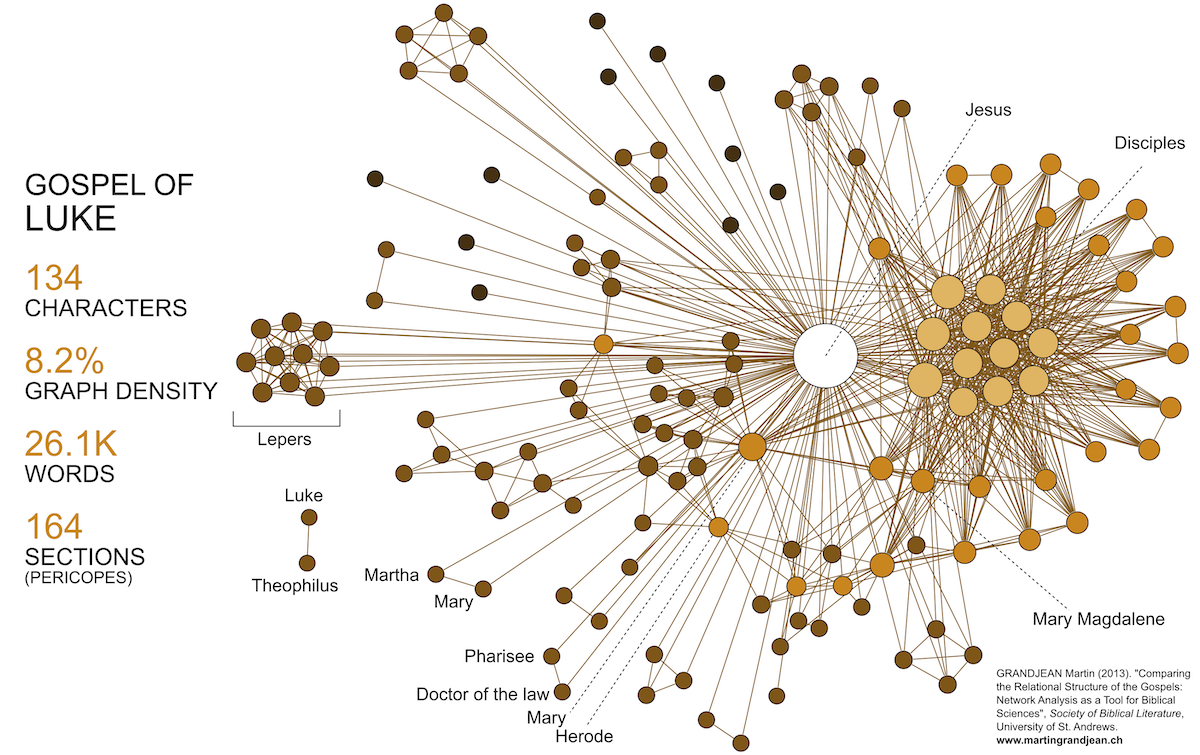
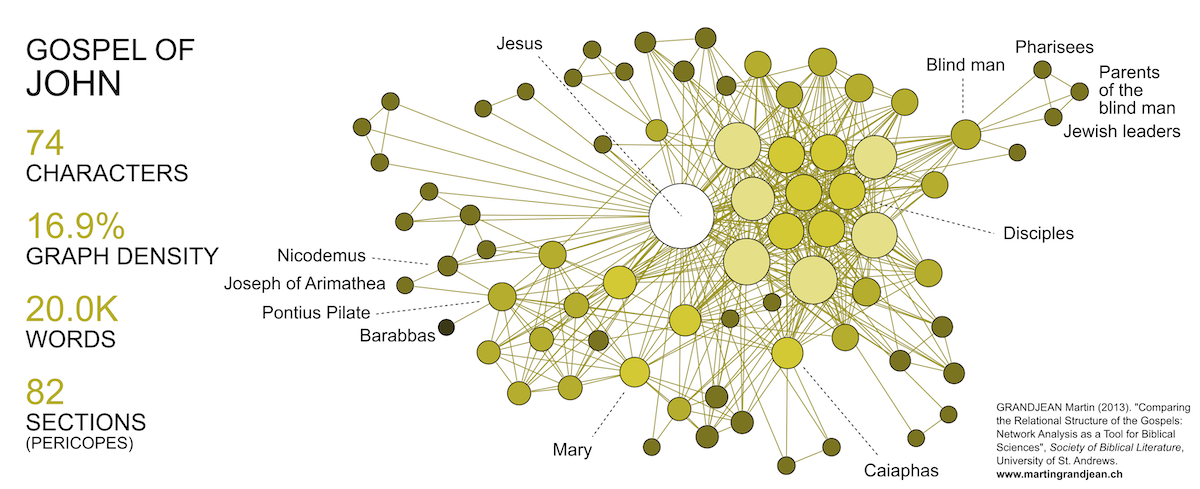
Two characters (circles) have a link (line) between them if they appear at the same time. The more often they appear together, the more they will form a dense cluster. This is what happens, for example, to the 12 disciples who invariably form a very dense group to the right of these four graphs. This does not mean, however, that the disciples form a homogeneous group (this is particularly visible in the Gospel of John). Technically speaking, two characters are considered to be connected if they appear in the same scene, or section (“pericopes”, to be exact in biblical parlance). These sections are coherent thematic, temporal and spatial unit. Find out more in the paper.
THE GOSPELS NETWORKS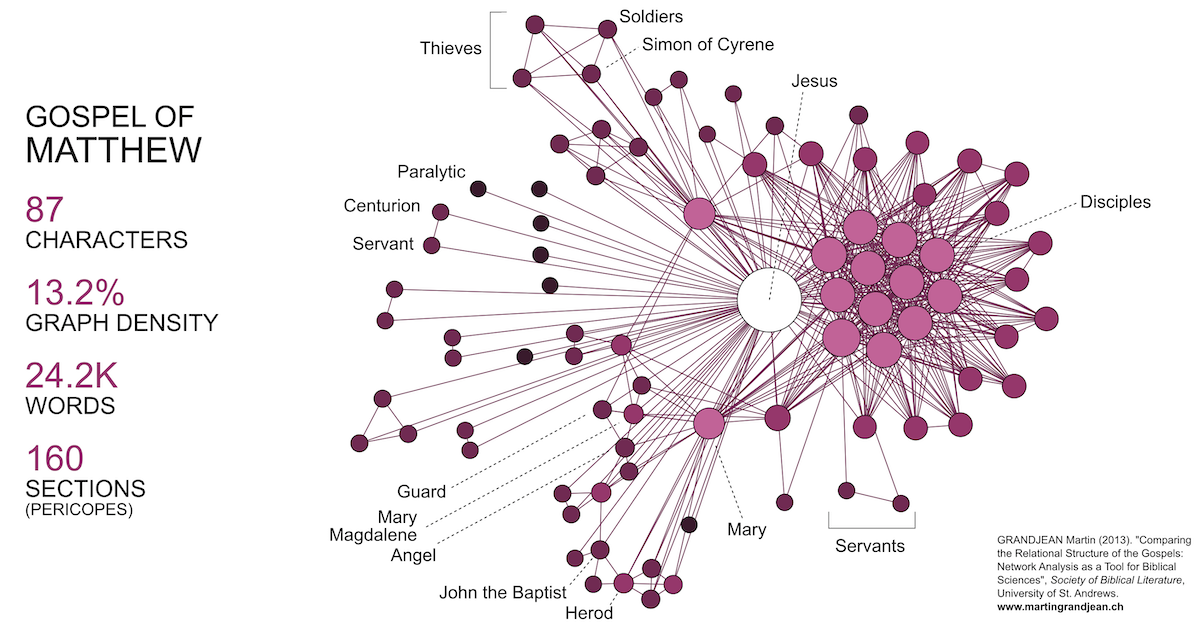
Interested in character networks?
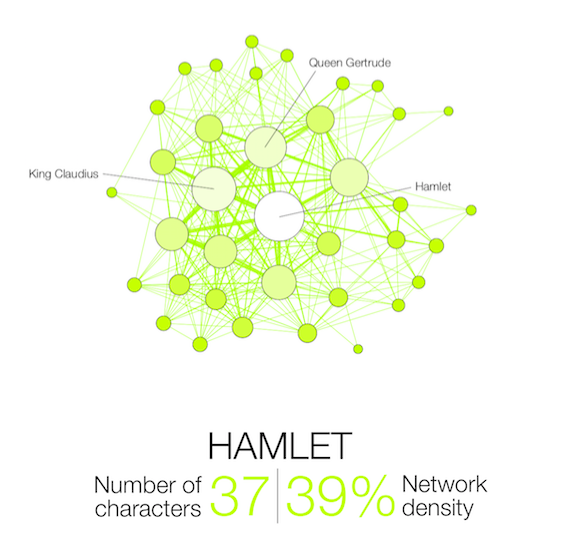
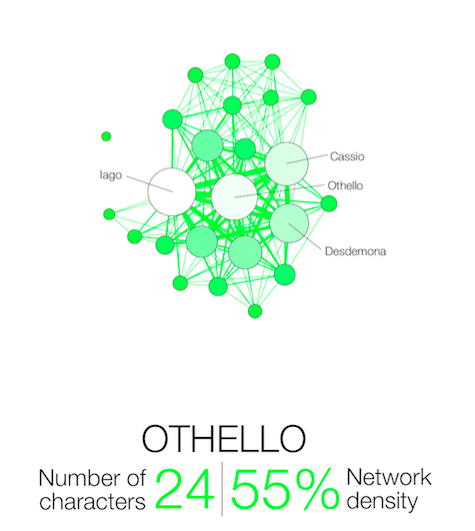
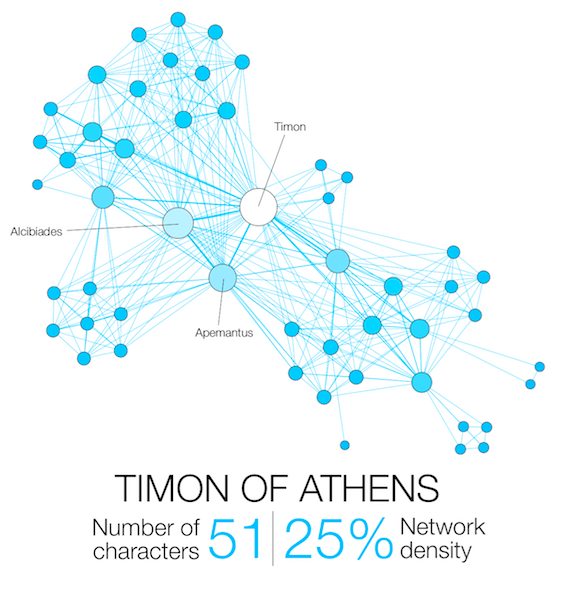
Have a look at this collection of all the Shakespearean tragedies: Network visualization: mapping Shakespeare’s tragedies
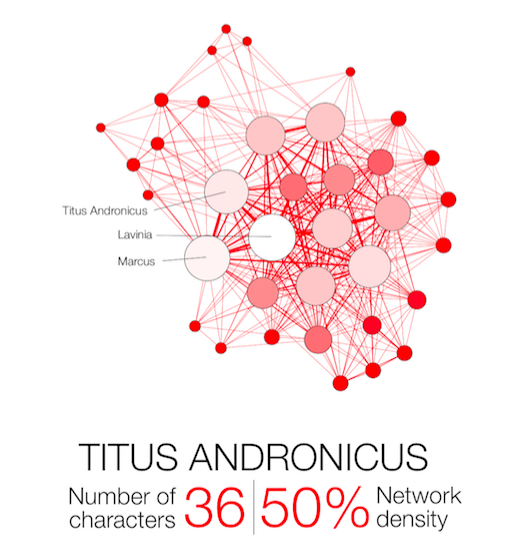 |
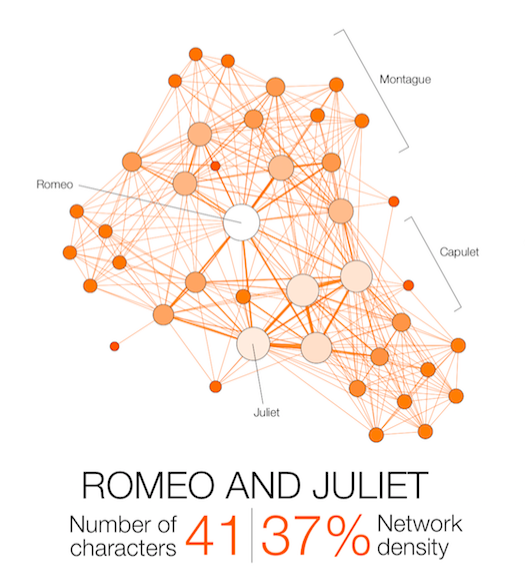 |
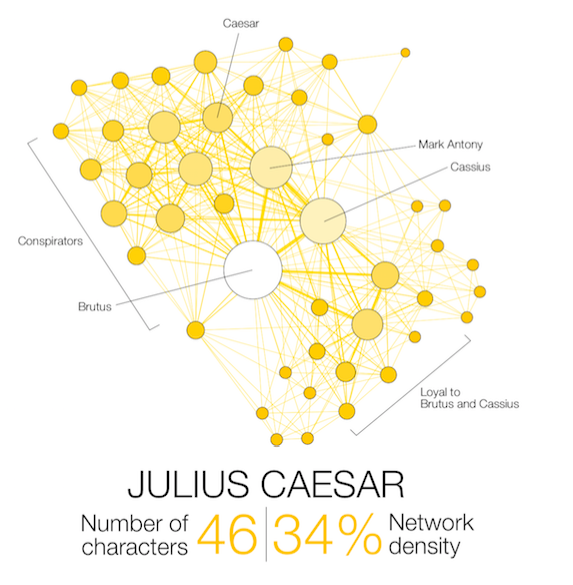 |
 |
 |
 |
 |
 |
 |
 |

This is fantastic! Thank you for your work! Are you able to share the .gephi file(s)?