Conference Paper “Intellectual Cooperation after the First World War“, presented at the Historical Networks Research Ghent, Sept 19. 2014.
[button size="medium" color="gray" style="none" new_window="true" link="https://www.academia.edu/8429905/Intellectual_Cooperation_after_the_First_World_War_Multi-Level_Network_Analysis_of_an_International_Organization"]Slides on Academia[/button]
[button size="medium" color="gray" style="none" new_window="true" link="https://www.researchgate.net/publication/265930196_Intellectual_cooperation_after_the_First_World_War_Multi-level_network_analysis_of_an_international_organization"]Slides on ResearchGate[/button]
Photo @Mundaneum
This paper presents an analysis of the work and functioning of the International Committee on Intellectual Cooperation (ICIC) between 1919 and 1927 by setting up a database containing metadata of thousands of documents contained in the ICIC funds (UN Archives, Geneva)1. Visualized as a network of nearly 1700 people (tens of thousands of relationships), this archive gives us a new understanding of the internal organization of the Intellectual Cooperation under the League of Nations, as well as interesting insights about its relations with the rest of the scientific and diplomatic world. In particular, it is necessary to compare the “micro” structure of relationships as mapped by the archive with the “macro” formal structure of the institution: does the thousands of documents confirm the internal organization of the League of Nations or does they show us individuals that bypass the official hierarchy?
League of Nations’ intellectual cooperation
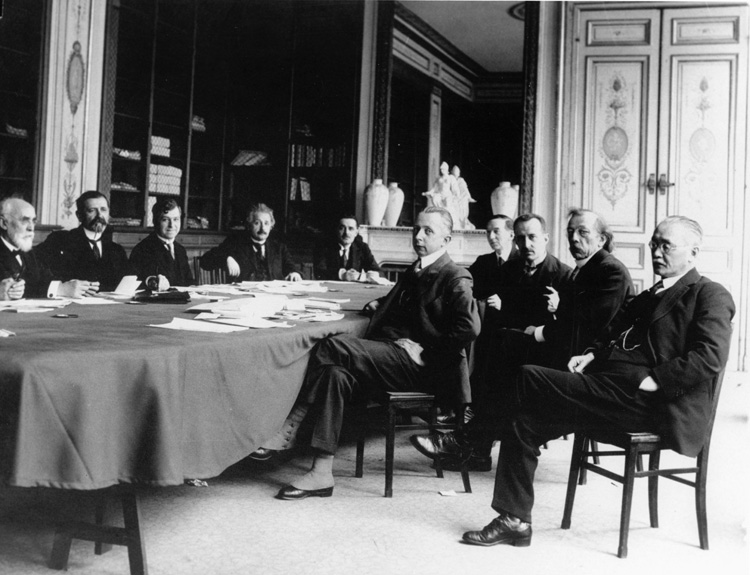
An ICIC session, Geneva [Indiana University League of Nations Photo Archives 1922]
The International Committee on Intellectual Cooperation (ICIC) has been founded in 1922 by the League of Nations on the observation that the pacification of Europe may pass through a better collaboration between scientific elites. It is responsible for coordinating the restructuration of knowledge circulation. Bringing together leading researchers at the height of their career, as Albert Einstein, Marie Curie or George Hale, chaired by Henri Bergson, the Committee weaves a complex network between transnational scientific institutions and societies, congresses and individuals.
After a few years, this Committee, on the invitation of the french Government, created the International Institute of Intellectual Cooperation in Paris (in 1926). Because UNESCO was founded after World War 2 on the remains on this Institute (who survived the war), it has been well described in the litterature, unlike the Geneva Committee, remaining partially in the shadow of his younger brother.
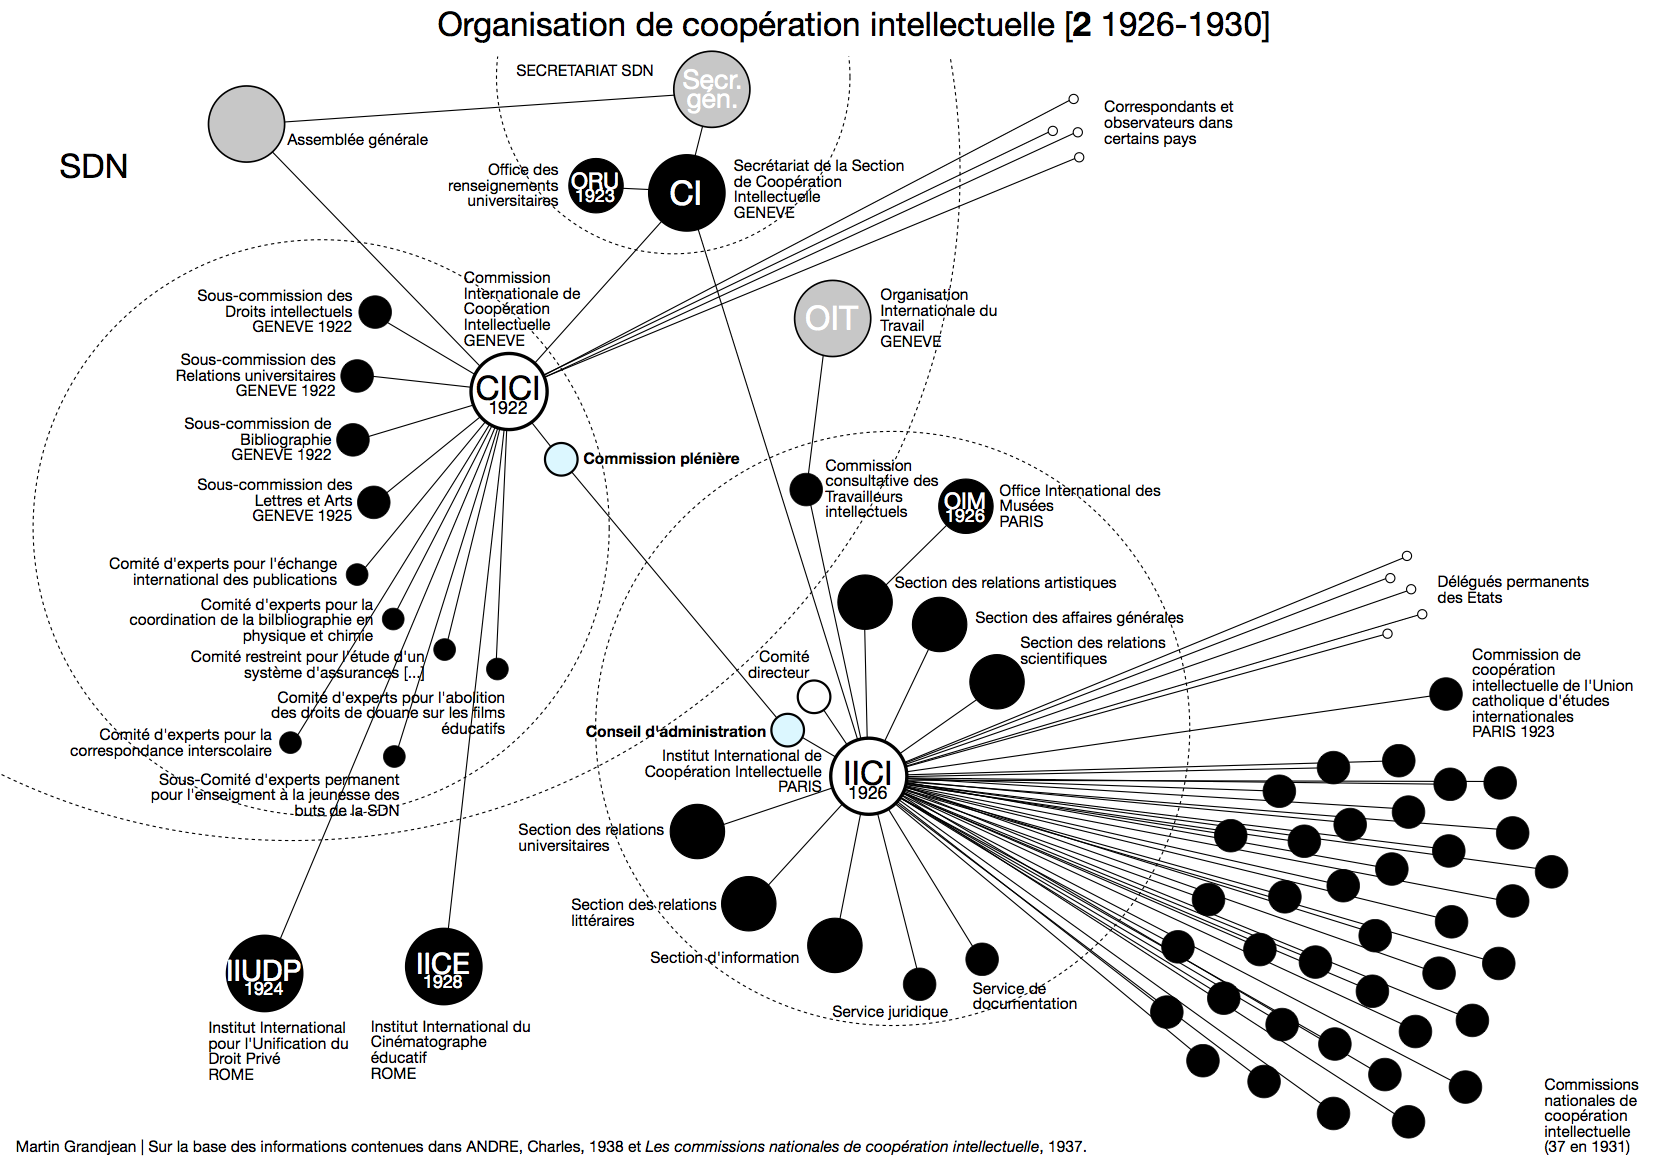
As we see on its organization chart, the ICIC hosts a number of thematic sub-committees. It is assisted in its work by the secretariat of the section of International Bureaux, directly related to the General Secretariat and the Presidency of the Assembly. Outside the strict boundaries of the League of Nations, three institutes are funded by governments: the Institute for the unification of private law and the Institute for educational cinematography, both in Rome, and the Institute of Intellectual Cooperation in Paris. This became progressively the executive center of intellectual cooperation: it receives its missions from the Geneva Committee, and was in charge of relations with the “outside world”, especially the National Commissions and the International Labour Office. It gets gradually internal sections, following concrete tasks.
But it is not the “big” (and monographic) political history of the institution that interests us, but what documents it has produced tell us of its real and living structure. In short, while this very rich object raises a multitude of questions, this paper focus on a technical aspect: the issue of visualization of different levels, the explicit and implicit structuration of the institution through the documents.
Methodology: an index is a network
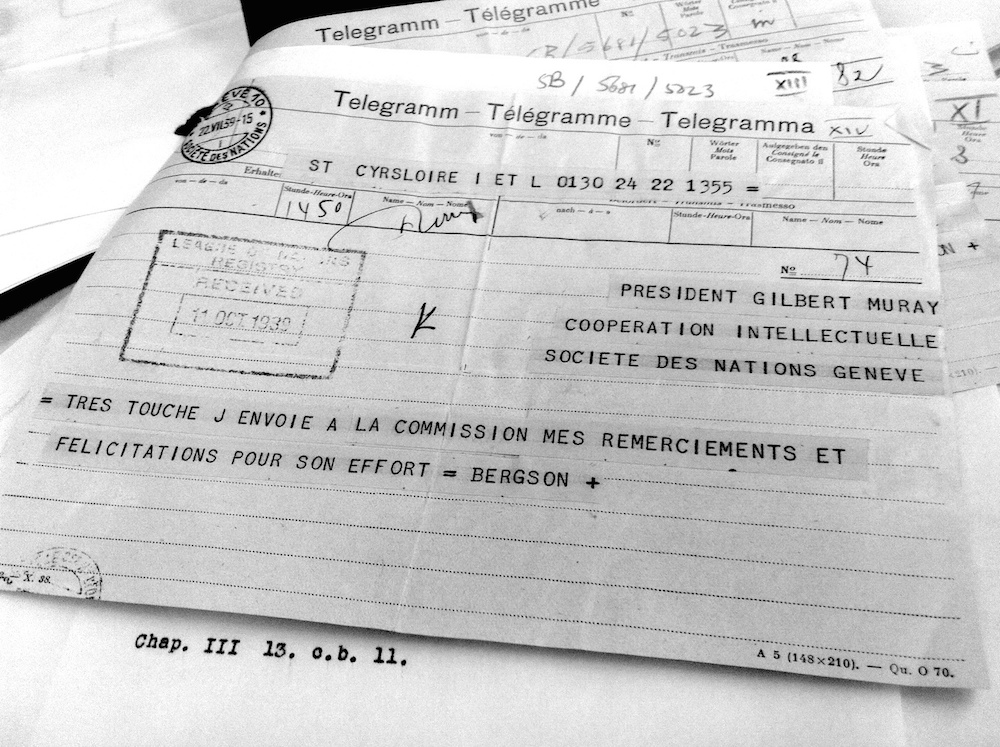
Telegram written by the philosopher Henri Bergson to one of his successor at the presidency of the Committee, the classical scholar Gilbert Murray.
As the archives of the ICIC, in the United Nations Offices in Geneva, represent a huge volume of documents, we elaborated a strategy consisting in the fastidious retrieval of a selection of documents metadata. In particular, we created an index of all “actors” (the sender and the recipient of the document – they may be several of each). In our study, we establish this « super-index » over the period 1919-1927. This periodization is the first of three temporal subdivisions of the archives of the League of Nations, the first archival operation of the institution. The choice of this period is also justified by a desire to seize the early stages of the dynamics of intellectual cooperation as initiated by the League and the dozen founding members of ICIC. It is also an exciting time because it saw the birth of Paris Institute, which later will take an important place in this system.
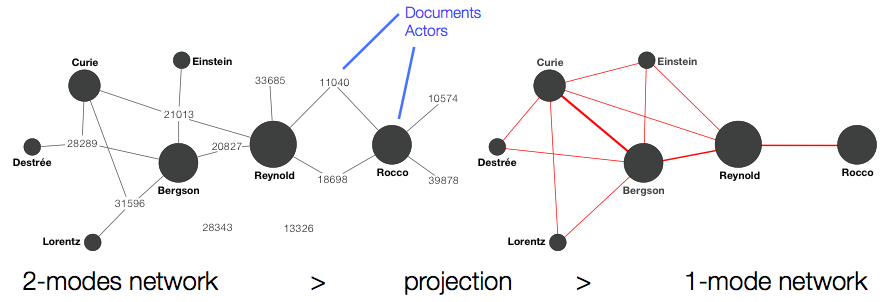
This index is a 2-mode network consisting of documents and the « actors » in these documents (once again, we are only talking about individuals who are active, not those cited in letters). This is followed by a projection to a one-mode network. The document is evacuated and replaced by an edge between actors.
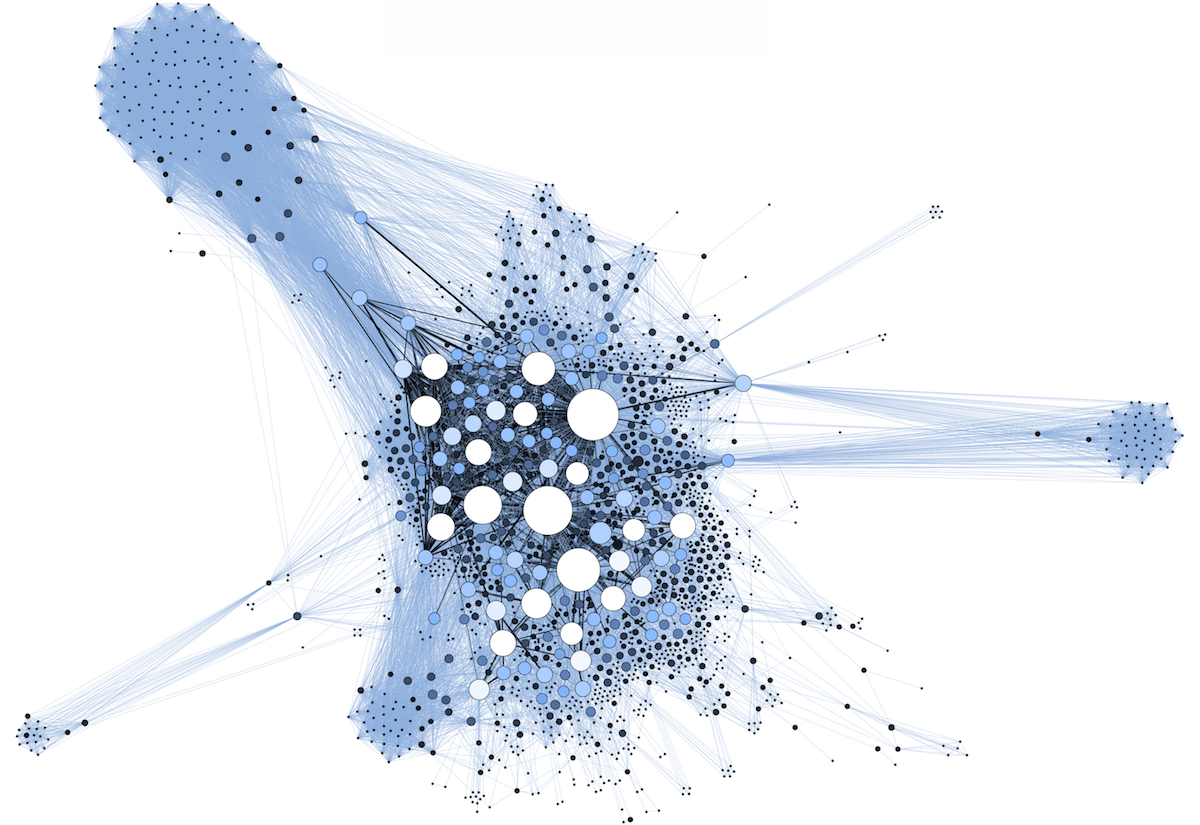
Here is the result for the concerned period (left)2. It consists of 1723 nodes, connected by 23181 edges that reflect the 31012 co-ocurrences of these people (thicker edges indicate multiple coocurrences, which is why this second number is higher than the first one). The size and color of the nodes are proportional to the number of appearance of the individuals in the index (black if under 10 times, blue if between 10 and 50, and white if more than 50). The size and color of the edges is proportional to the number of cooccurrences of the two people they bind (blue if less than 10 times, black if more).
Beyond a poor intelligible visual appearance, due to the amount and complexity of the data, such a graph already makes possible the measurement of its mathematical properties and that of its components (centrality indices, for example). It provides a global view and a more instinctive navigation in the archive directory. This type of graph is interesting to observe what happens at the margins of the institution. However, as so often in network analysis, the core is so dense that we can not distinguish the edges and therefore does not makes possible a more advanced visual analysis.
Multi-level: playing with the scale
There are several school:
- To build a 2-mode network to displays individuals connected to their institutions
- Assign individuals categories or attributes imposed vertically by the institutional organisation
- Consider that the two levels of action are different and always keep two layers that overlap very little
- In our case, there are reasons to believe that the micro-structure does not always look like the macro-structure, but we can flatten the institutional organization on the individual, but we keep these two layers to analyze them separately.
Hence our research question: Does scientists, diplomats and senior officials structure their relationships in coherence with the organization of their institution? Or are they the ones that determine the links that their institutions maintain together?
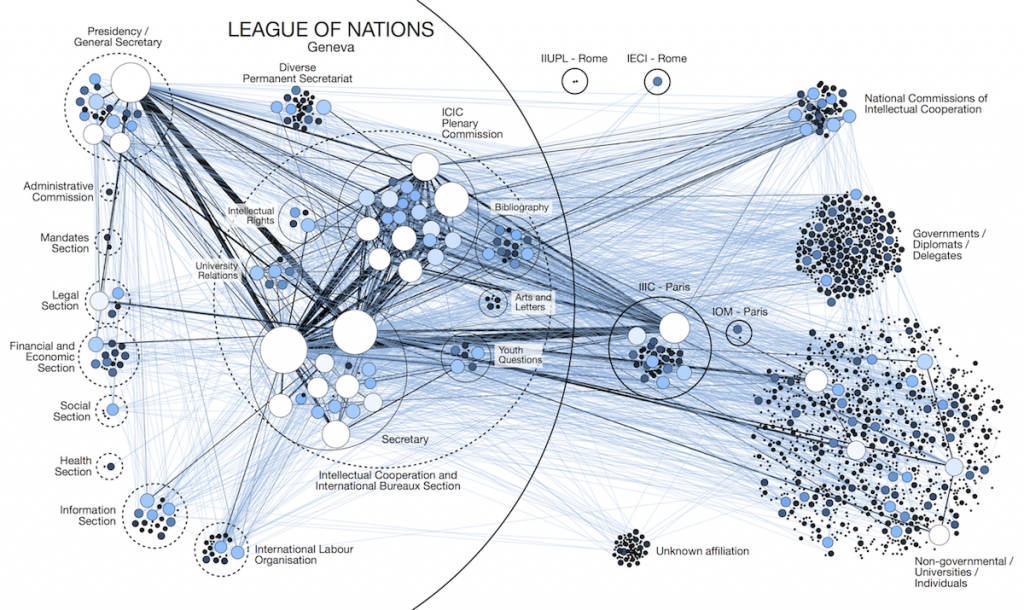
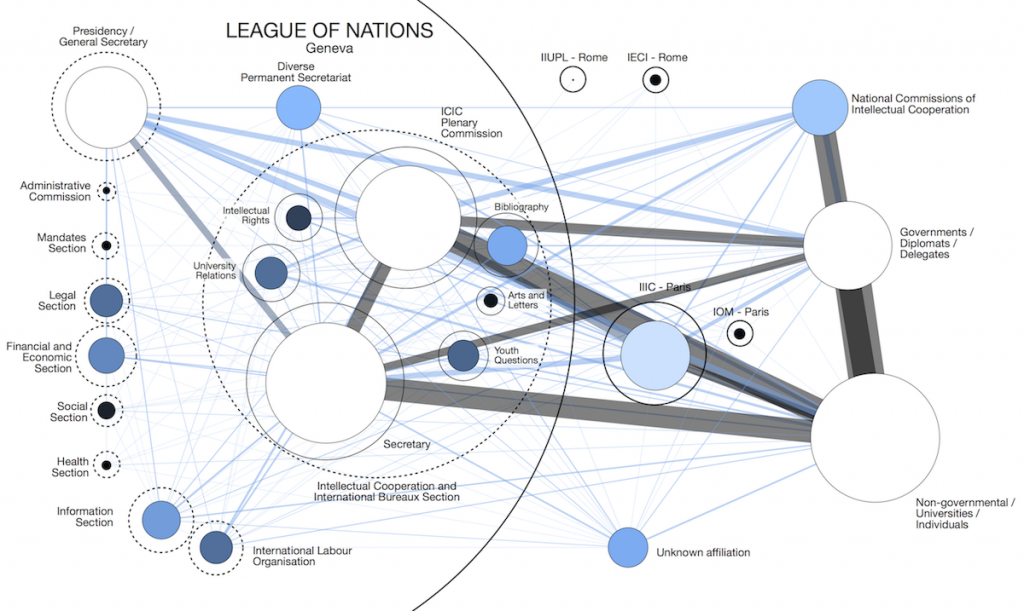
This network is a true copy of the graph presented above, same data, same scale and color code. The only thing that changes is the spatialization of the nodes, which are no longer submitted to a force-directed algorithm but simply placed according to their institutional affiliation.
Quickly, we see here the plenary ICIC committee, its secretariat, its subcommittees. Inside the League of Nation, we find the other sections, the General Secretary. And outside, the Paris Institute, the National Commissions of Intellectual Cooperation, and rich nebulae of governments, diplomates and delegates or non-governmental individuals. This forced distribution of nodes under an administrative « geography » makes it easier to read the edges between groups. This system is suitable for superimposing prosopographic informations by highlighting groups (nationalities, etc.), categories of individuals (women, scholars, etc.) or ego-networks (all the correspondents of an individual).
Of course, this kind of structural network needs to be analyzed not only as a global object, but also as many little clusters.
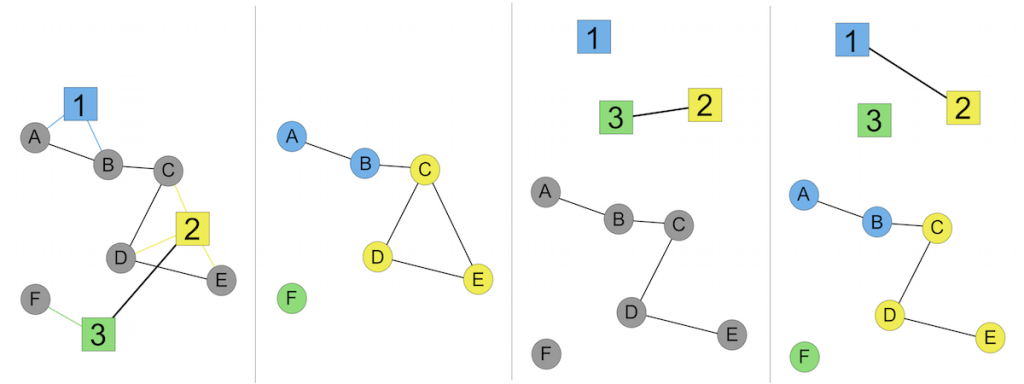
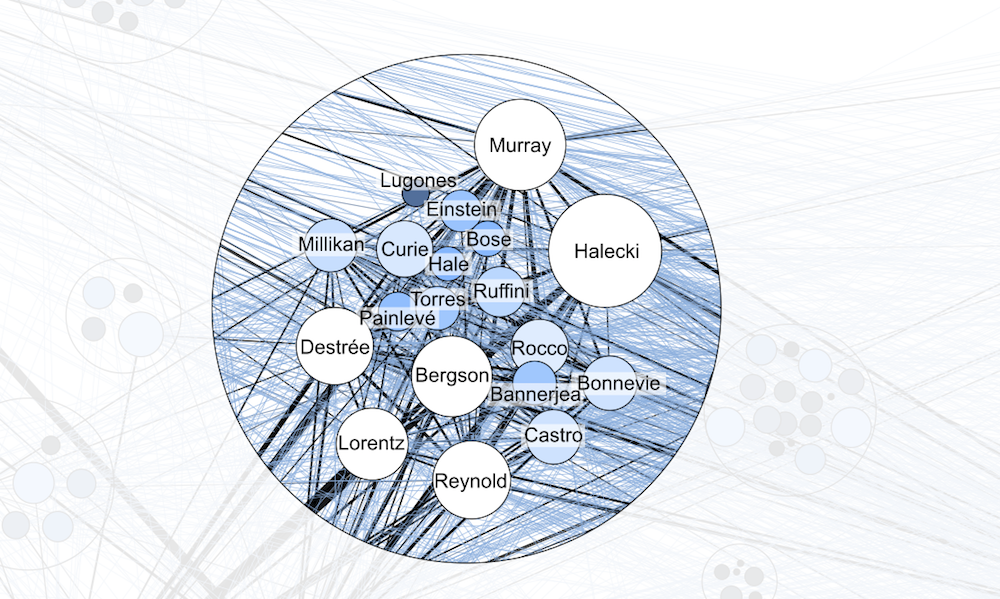
We need to evaluate the consistency of these internal networks. Here left, the plenary Committee. Are each administrative subdivisions cliques? Are theses cliques created by a coherent group of documents (which will be the case for the plenary committee, but certainly not for other internal subdivisions) or by an eterogeneous collection of documents, maybe interconnected by a thematic unity?
This last network (left) is a contraction of the previous one: it represents only the co-occurrences that bind individuals belonging to different groups. Consequence: the result is far from the previous graph. We lost a third of edges (internal to the groups). Visually, this network expresses something that was not obviously visible before: We may have been seduced by the high density of edges connecting a small number of individuals, especially the secretaries of the committee and its members. In fact, it is with external correspondents that the commission is the most associated. “Small” actors are much more numerous than the “big” highly visible actors: there are only about thirty people in the ICIC and its secretariat, while there are hundreds of them out! In fact (it is a trivial result) we forget it systematically since we are always attracted to people whose centrality is important.
Conclusion
The game between these three pictures (showing exactly the same data) is an example of the relevance of multi-level analysis: according to data granularity, the conclusions are different. Not contradictory since they are only two points of view on the same object.
Using quantitative to return to qualitative. This approach is characterized by a reintroduction of the qualitative analysis in a method yet seemingly coldly quantitative. The organizational structure of such a network is indeed a qualitative information3. This qualitative information derives from the quantitative compilation of individual relations in the index.
Such a network is a tool (not an end in itself), searchable and mobilized according to specific research questions. Beyond the overlay of biographical or geographical informations, which may also be considered as part of a traditional network analysis, the multi-level analysis can highlight patterns (and irregularities) and provide researchers with a new way of understanding the practical organization of the institution.
- Already presented in a journal paper: Grandjean 2014 “La connaissance est un réseau”, described here and on a poster available here ↩
- All graphs drawn with Gephi. ↩
- see Moretti 1999 “Atlas of the European Novel 1800-1900”, 66 ↩


Trackbacks/Pingbacks